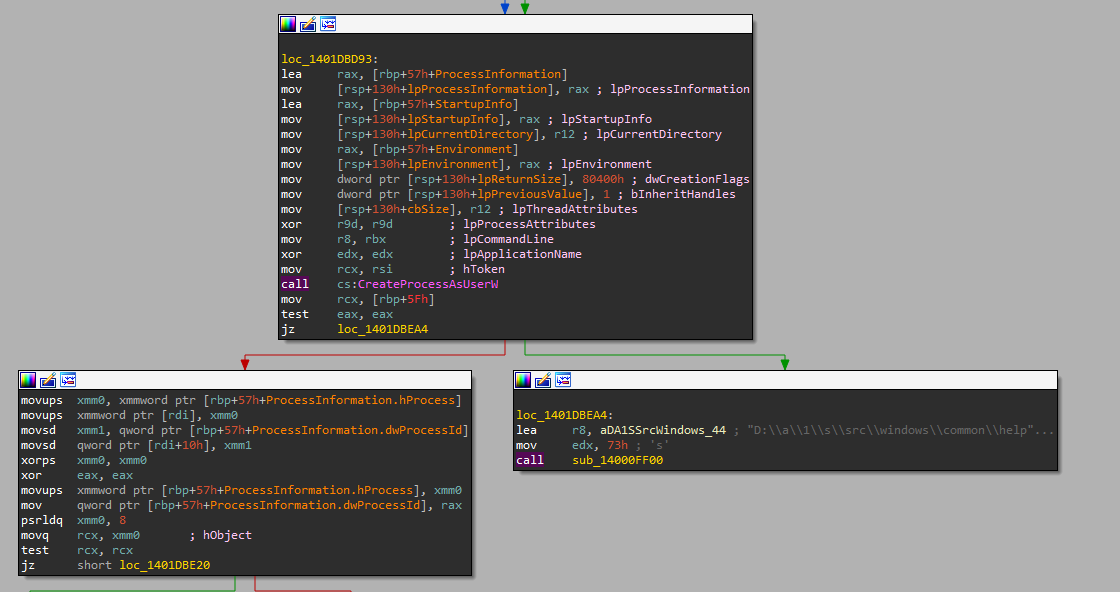
IDA (Interactive DisAssembler) is a professional reverse engineering tool used to analyze compiled software by converting binary code into human readable assembly instructions. It supports a wide range of architectures and provides advanced features such as graph based code views, function analysis, debugging capabilities, and integration with scripting through IDC and Python.
For TrainSec students, IDA is important because it is one of the industry standard tools for malware analysis, vulnerability research, exploit development, and Windows internals work. Mastering IDA helps students understand how code behaves at a low level, identify hidden logic, unpack or analyze malicious software, and gain the foundational skills required for professional reverse engineering roles.
In this video, I’ll show you how to debug a DLL file with an IDA Disassembler. Many people find debugging DLL files challenging with IDA Disassembler Pro and often prefer tools like x64dbg, which automatically imports and executes the DLL. However, with IDA Disassembler, the process is a bit different. Let’s explore how to do it.
Step 1: Determine DLL Bit Version
Before starting, identify whether the DLL file is 32-bit or 64-bit:
- If the DLL is 64-bit, use the 64-bit version of IDA Disassembler.
- If the DLL is 32-bit, use the 32-bit version.
In this example, we’re using a 32-bit DLL.
Step 2: Load the DLL in IDA Disassembler Pro
- Launch IDA Disassembler.
- Load the DLL file. In this example, your desired DLL (Emotet in this example).
- Place a breakpoint at the prologue of the first function.
- Confirm that we’re in the DLL’s entry point. Check the exports of the DLL – in this case, there’s only one export.
Step 3: Configure the Debugger in IDA Disassembler
- Select the Debugger: Choose “Local Windows Debugger” as the debugging environment.
- Set Process Options:
- Go to
Debugger>Process Options. - Since DLL files don’t execute on their own and need a host executable to import and run their functions, we need a process that can load the DLL.
- Go to

$2,312
$1,618 or $170 X 10 payments
Windows Security Researcher
Provides the necessary knowledge, understanding, and tools to be a successful Windows OS researcher.
Step 4: Configure the Executable to Load the DLL
- Use
rundll32.exe, a system executable capable of loading and executing functions from a DLL. - Path Configuration:
- For a 32-bit DLL, use the 32-bit version of rundll32.exe, located in the C:\Windows\SysWOW64\ directory (even though the folder name can be confusing, it contains 32-bit system binaries).
- Enter the path: C:\Windows\SysWOW64\rundll32.exe.
- For a 64-bit DLL, use the 64-bit version of rundll32.exe, located in the C:\Windows\Systems32\ directory.
- Enter the path: C:\Windows\System32\rundll32.exe.
- Set Parameters:
- Specify the DLL’s directory as the working directory.
- For the parameters, include the DLL’s full path and add
,#1to indicate the first (and only) export, the DLL entry point.
Step 5: Test and Debug
- Run the Debugger: Execute the setup by clicking “Run.”
- Verify the Breakpoint: You should hit the breakpoint set at the entry point, allowing you to debug the DLL freely.
Thank you for watching!
This content is part of the Windows Security Researcher learning path.
Liked the content?
Subscribe to the free TrainSec knowledge library, and get insider access to new content, discounts and additional materials.


