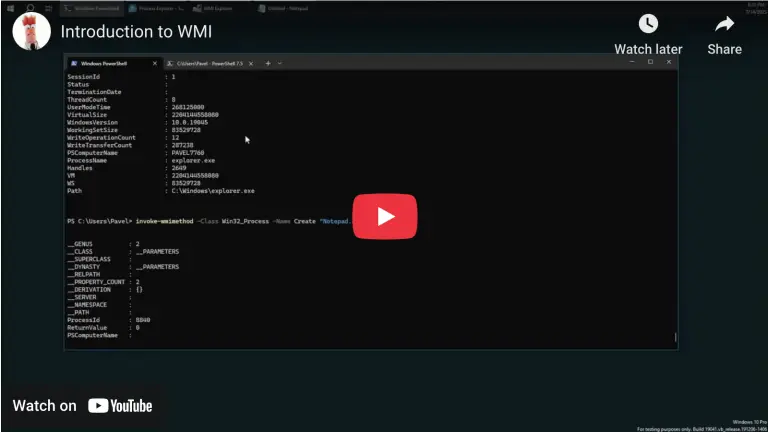

Note: This blog post is designed to complement the accompanying video embedded at the top of the page. The video provides an in-depth, visual demonstration of the concepts and code discussed here, making it an invaluable resource for learners.
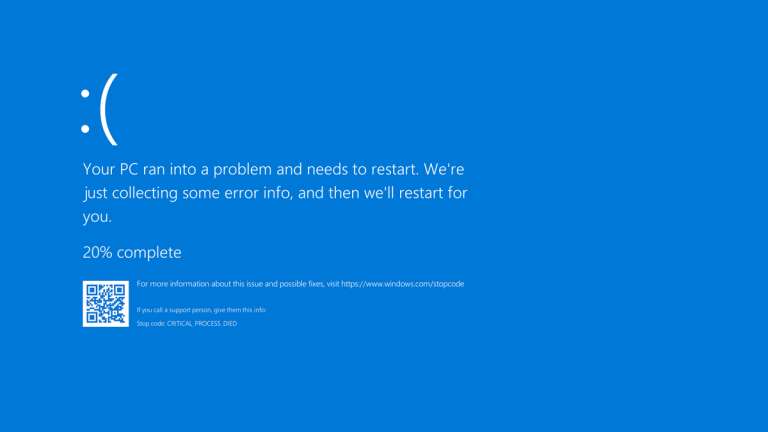
Today, I want to talk to you about something often dreaded but incredibly valuable for anyone aiming to master Windows at a deep technical level: the Blue Screen of Death (BSOD). Although it may look like a dire warning that your system has just met its end, the BSOD is really a protective measure—Windows’ way of preventing further damage when it detects a critical error in kernel mode.
Why the BSOD Matters
When a BSOD occurs, it means something has gone seriously wrong at the kernel level—perhaps a driver wrote beyond the bounds of a buffer, an exception went unhandled, or a data structure became corrupted. Rather than letting the system continue in an unstable state and risk permanent damage, the operating system “pulls the plug” and halts everything. While it is certainly inconvenient, this immediate stop ensures data integrity and makes troubleshooting far more straightforward once you collect and analyze a memory dump.
For students at TrainSec, especially those enrolled in the Windows Internals Master learning path, understanding BSODs is crucial. Diagnosing and resolving system crashes is at the heart of true Windows mastery, and it’s a skill that separates a casual enthusiast from a truly advanced professional.
Tools & Techniques
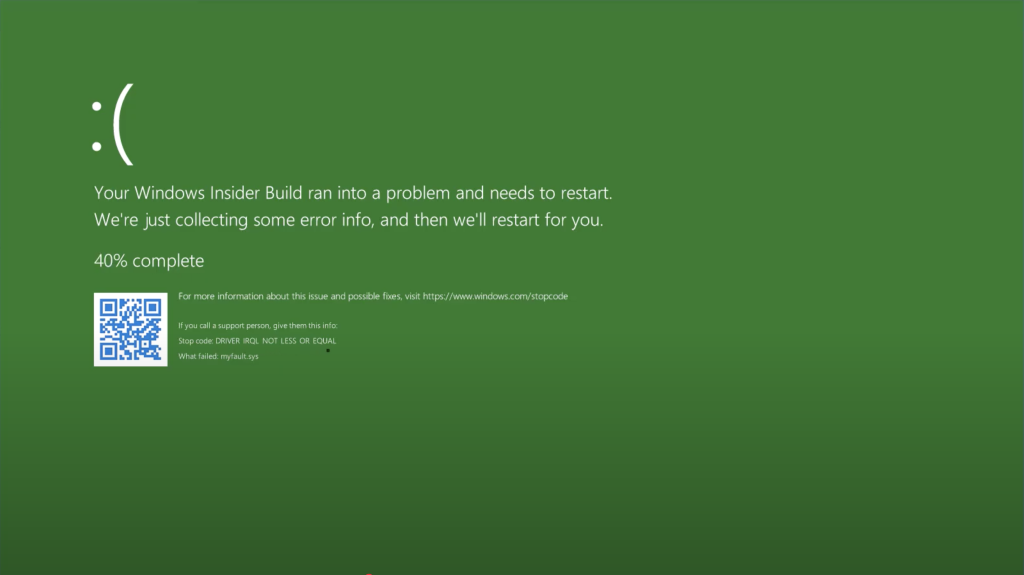
One tool I like to demonstrate in my courses is NotMyFault (part of the Sysinternals suite). This nifty utility forces the operating system to crash in various ways—such as buffer overruns, double-frees, or even instant crashes—so you can practice capturing memory dumps and analyzing what exactly led to that “blue” or sometimes “green” screen (Insider Preview builds show a green screen instead).
- Configuring Dump Settings: Before generating a test crash, head to “Advanced system settings” → “Startup and Recovery.” Make sure you have a proper dump configuration—“Automatic memory dump” is a good default.
- Capturing the Crash: Once your system goes down, it writes the dump to the page file. On the next reboot, Windows copies that data to the dump file of your choice, usually
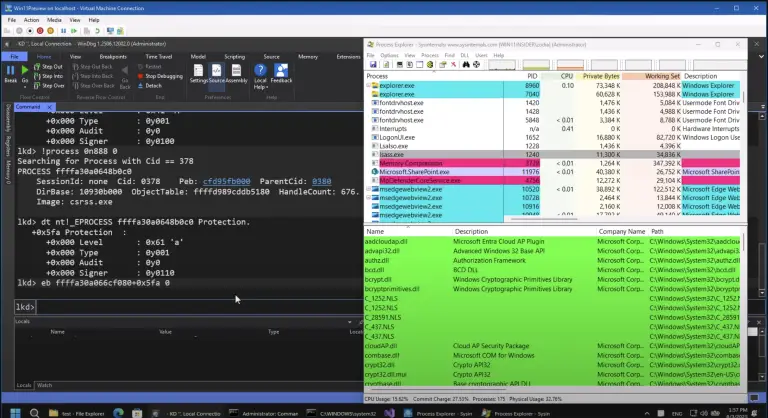
C:\Windows\MEMORY.DMP. - Analyzing with WinDbg: Load up WinDbg, open the dump file, and run commands like
!analyze -vto see what caused the crash. You might see something obvious—likemyfault.sysin the stack trace—or you might have to go sleuthing through kernel objects.
For more complex situations, Driver Verifier is another powerful tool. It actively checks your selected drivers, forcing them to work in a “harsher” environment. Any mishandling—like a buffer overflow or double-free—becomes instantly evident, triggering a crash that finger-points the offending driver in the dump file. This method is invaluable when you suspect a driver bug that doesn’t appear in standard conditions.
Relevance to the Windows Internals Master Path
If you’re part of our Windows Internals Master learning path, all this is more than theory. By experimenting with forced crashes, analyzing system dumps, and delving into driver verifier tests, you develop the kind of expertise that employers and the cybersecurity industry truly respect. You’ll move beyond textbook knowledge and into real-world debugging.
Mastering BSOD diagnosis not only makes you a better troubleshooter but also deepens your understanding of how Windows manages hardware resources, memory, processes, and drivers. This is exactly what the Windows Internals Master path is all about—ensuring you have the hands-on skills and in-depth knowledge to handle the most challenging issues that arise in the Windows ecosystem.
Parting Thoughts
While the Blue Screen of Death may look intimidating, I encourage you to embrace it as a powerful learning opportunity. By taking advantage of the very circumstances that cause Windows to crash, you gain insight into the OS at its core. In the world of cybersecurity and Windows research, few things set you apart like the ability to diagnose and resolve complex kernel issues. Keep experimenting, keep digging, and never shy away from a “little crash” when it can push your expertise forward!
Thank you for reading, and I look forward to seeing you continue to sharpen your skills on TrainSec.net. As always, stay curious, stay motivated, and aim for mastery. If you have any questions, drop into our community forums or reach out to me directly. Happy debugging!
Explore the accompanying video for a detailed walkthrough of the code and concepts, and keep experimenting.
For more insights into Windows internals and advanced programming concepts, keep exploring TrainSec’s free Knowledge Library. Stay tuned for more deep dives into topics that empower your technical growth!