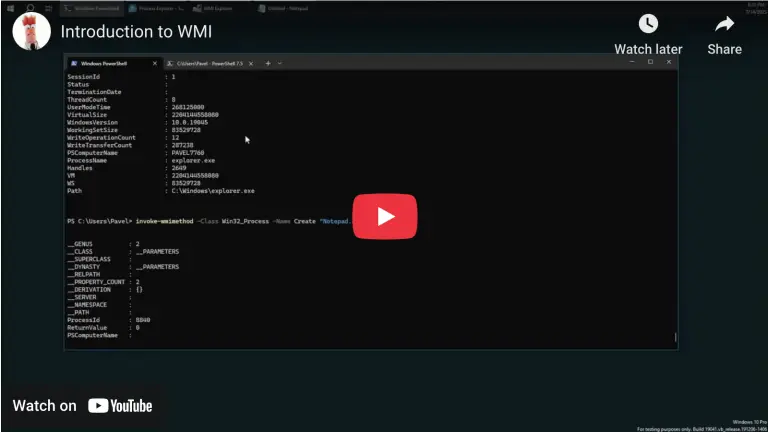

Note: This blog post is designed to complement the accompanying video embedded at the top of the page. The video provides an in-depth, visual demonstration of the concepts and code discussed here, making it an invaluable resource for learners.
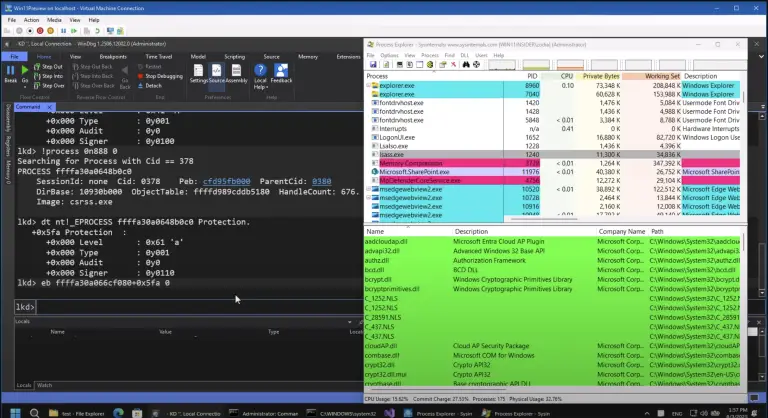
Debugging Windows at kernel level lets you watch every CPU instruction, intercept system calls, and step through driver code. In the video above, Pavel Yosifovich shows how to do this safely by treating a virtual machine (VM) as the target while you run WinDbg on the host. Below is a concise recap, extra tips, and links to TrainSec paths that will help you turn these first steps into real expertise.
Over the years I’ve debugged Windows on every device you can imagine—from bare-metal servers in noisy labs to tiny IoT boards on my desk. Yet my favourite setup is still the simplest: kernel-debugging a virtual machine (VM) from the comfort of the host. In the video above I walk you through the process step-by-step; below is a written companion you can keep open while you experiment.
Why we need a VM / “second machine”?
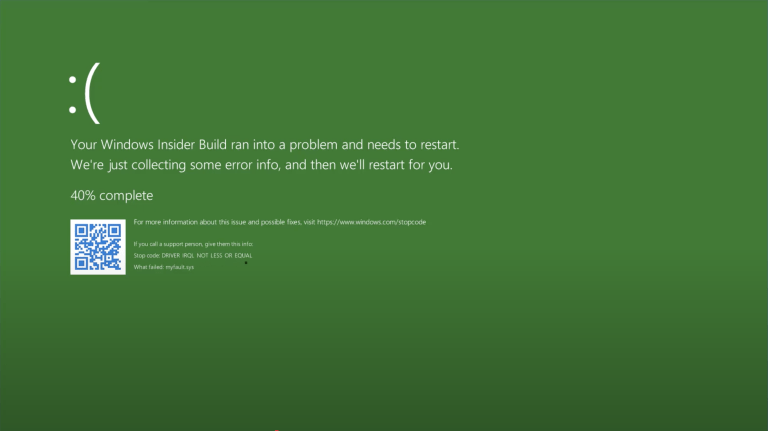
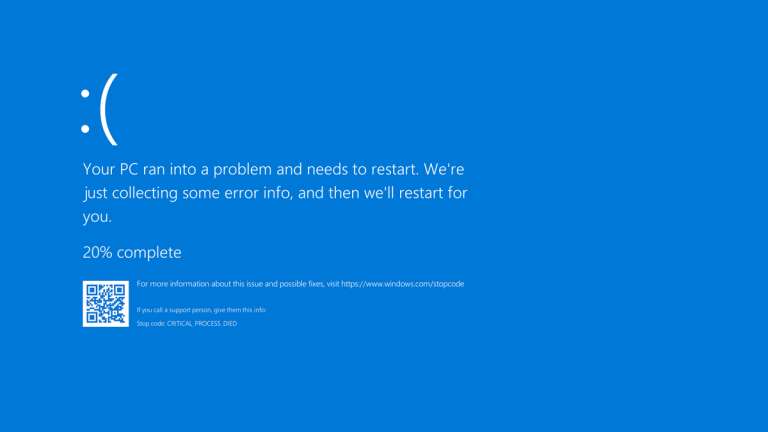
Kernel breakpoints freeze the entire OS. If you tried them on your daily-driver PC you’d lock yourself out of mouse, disk, and network until the debugger says “go”. By running the target inside a VM and WinDbg on the host, we isolate the crash-and-break cycles and keep our tools responsive.
Setting up the guest
STEP 1: Turn on debug mode inside the VM:
bcdedit /debug on
bcdedit /dbgsettings net hostip:<HOST_IP> port:55000 key:1.2.3.4STEP 2: Temporarily disable Secure Boot so Windows accepts the change.
STEP 3: Reboot the guest—don’t worry, it will pause almost immediately when we attach.
Listening from the host
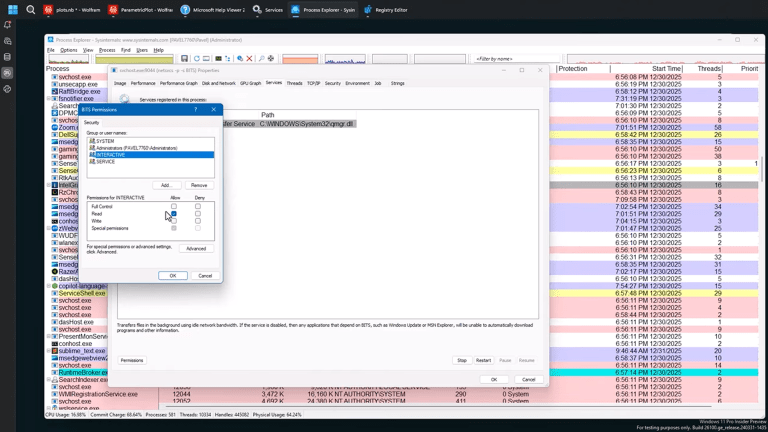
- Open WinDbg as Administrator.
- Choose File → Kernel Debug → NET, enter the same port and key, and press OK.
- WinDbg shows “Waiting to reconnect…”. The moment the VM restarts you’ll see a
KD>prompt, often insideKdInitSystem, meaning you’ve caught Windows before it even loads the GUI.
First breakpoint adventures
bp nt!NtCreateFilestops all processes whenever the kernel creates a file.- Want to watch just one process? Pair the breakpoint with its EPROCESS pointer:
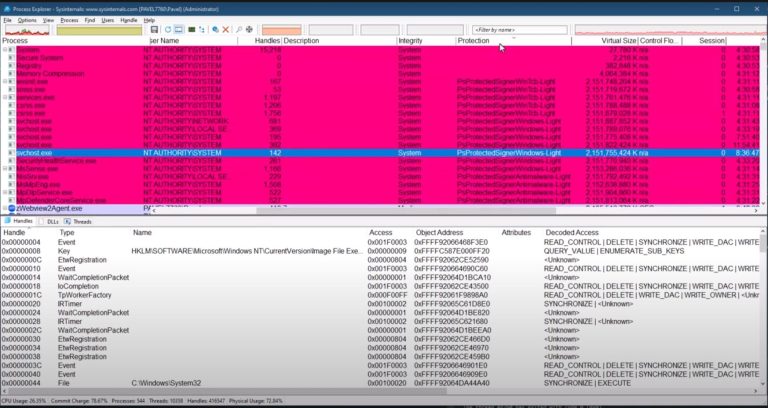
bp /p <EProcessAddr> nt!NtCreateFile - Use Ctrl + Break at any time to halt the entire guest and inspect memory, handles, or IRPs.
Common speed-bumps
| Symptom | Quick fix |
| WinDbg refuses to listen | Another app grabbed the port—pick a higher number. |
| Symbols don’t load | Add srv* to File → Symbol File Path and reload. |
| VM no longer connects | DHCP changed your host IP—rerun bcdedit /dbgsettings inside the guest. |
Turning this demo into mastery
If today’s exercise felt empowering, imagine chaining dozens of such techniques together—single-stepping drivers, inspecting IRPs, analysing dump files, and writing your own kernel code. That’s exactly what we cover in:
- Mastering WinDbg – 67 hands-on lessons dedicated to both user- and kernel-mode debugging.
- Windows Kernel Programming 1 & 2 – build real drivers and learn the kernel APIs you just traced.
- Windows Internals Master – a five-part deep dive into the OS architecture behind every breakpoint you set.
Each path is self-paced, comes with lab VMs, and plugs straight into our Discord so you’re never stuck alone.
Before you go…
The TrainSec Knowledge Library hosts this article, dozens of free write-ups, and curated links to help you grow from curious developer to seasoned cybersecurity professional. New pieces constantly drop, subscribe to our mailing list and I’ll make sure fresh kernel tips (and occasional war stories) land directly in your inbox.
See you at the next breakpoint!
Liked the content?
Subscribe to the free TrainSec knowledge library, and get insider access to new content, discounts and additional materials.