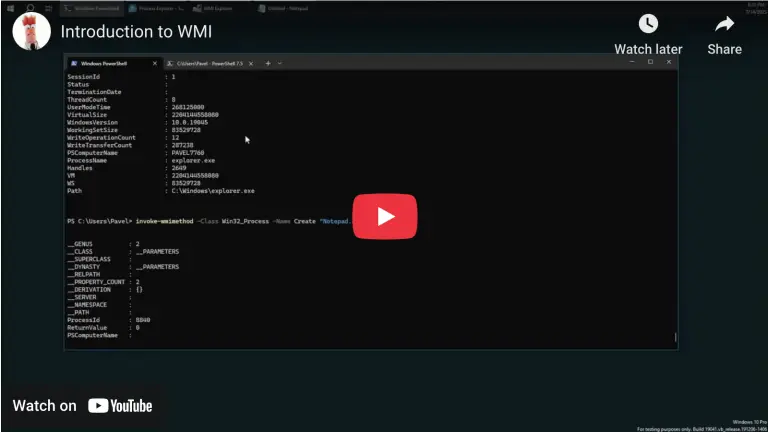

Note: This blog post is designed to complement the accompanying video embedded at the top of the page. The video provides an in-depth, visual demonstration of the concepts and code discussed here, making it an invaluable resource for learners.
Introduction: Why Write a WinDbg Extension?
WinDbg is a powerful and highly extensible debugger that is widely used for Windows development, reverse engineering, and security research. If you’ve spent time debugging with WinDbg, you’ve likely used extension commands—many of which come built into the Debugging Tools for Windows package.
But what if you need custom debugging commands to automate repetitive tasks, extract complex information efficiently, or enhance your workflow? That’s where WinDbg Extensions come in. In this post, we’ll explore how to write a WinDbg extension DLL, load it into the debugger, and create a command to display kernel object types—all while making debugging easier and more efficient.
For TrainSec students, this knowledge is crucial for Windows Internals, Kernel Debugging, and Reverse Engineering courses, as writing extensions can significantly improve your debugging workflow and reduce manual effort.
Understanding WinDbg Commands and Extensions
Before we dive into writing our own extension, let’s briefly examine the different types of commands in WinDbg:
1️⃣ Regular Commands: These are built into the debugger engine and operate directly on the target (e.g., k for stack traces).
2️⃣ Meta Commands (. Commands): These modify the debugging environment (e.g., .reload for symbol reloading).
3️⃣ Extension Commands (! Commands): These are provided by external DLLs and extend WinDbg’s functionality.
Since extension commands (prefixed with !) are just functions inside a DLL, we can create our own custom commands to enhance debugging efficiency.
Steps to Write a WinDbg Extension
To write a WinDbg extension DLL, you’ll need to:
1️⃣ Create a DLL project in Visual Studio
2️⃣ Export functions for custom commands
3️⃣ Load the extension in WinDbg
4️⃣ Test and refine your command
Step 1: Setting Up the Project
1️⃣ Open Visual Studio and create a new DLL project using the Windows Desktop Wizard.
2️⃣ Name the project TypesExt and choose the default DLL template.
3️⃣ Add the necessary Windows debugging headers:
#include <windows.h>
#include <dbgeng.h>  // Debugger Engine Interfaces
#include <wdbgexts.h> // WinDbg Extension Macros
Step 2: Implementing the Extension Initialization
Every WinDbg extension DLL must implement the DebugExtensionInitialize function, which is called when the extension is loaded:
HRESULT CALLBACK DebugExtensionInitialize(
    PULONG Version, PULONG Flags) {
    *Version = 1;
    *Flags = 0;
    return S_OK;
}
This function ensures the debugger recognizes the extension properly.
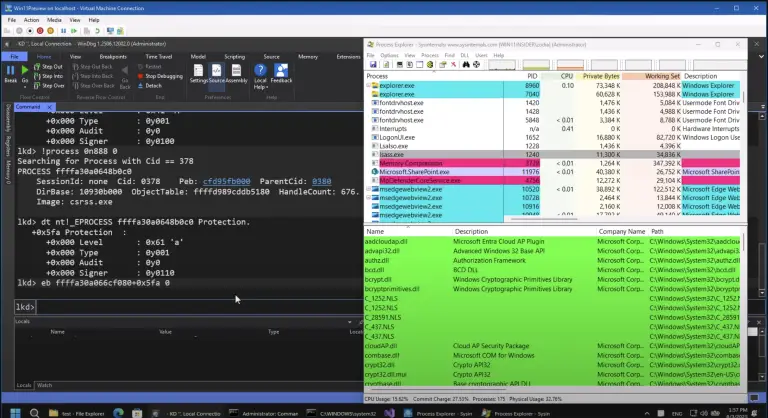
Step 3: Creating a Custom Debugger Command
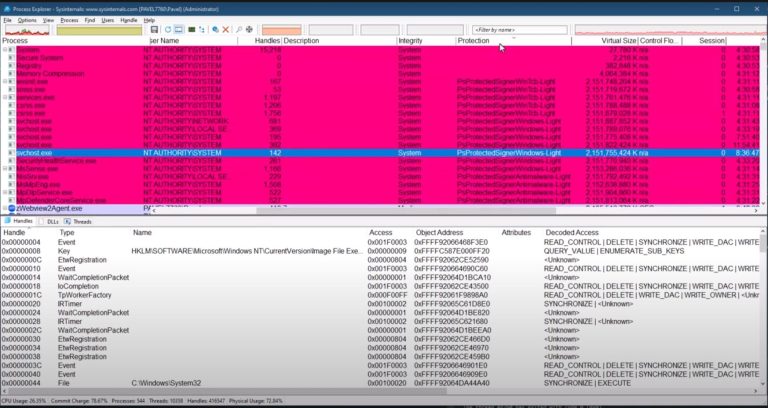
Now, let’s define a command called !objecttypes that retrieves and displays all object types in the kernel.
HRESULT CALLBACK objecttypes(PDEBUG_CLIENT Client, PCSTR Args) {
    dprintf("Displaying all object types...\n");

    ULONG64 objTypesAddr = GetExpression("nt!ObpObjectTypes");
    if (objTypesAddr == 0) {
        dprintf("Error: Could not locate nt!ObpObjectTypes.\n");
        return E_FAIL;
    }

    while (true) {
        ULONG64 typeAddr;
        if (ReadPointer(objTypesAddr, &typeAddr) != S_OK || typeAddr == 0) break;
        objTypesAddr += sizeof(ULONG64);

        CHAR typeName[MAX_PATH];
        if (GetFieldValue(typeAddr, "nt!_OBJECT_TYPE", "Name", typeName) == S_OK) {
            dprintf("Type: %s\n", typeName);
        }
    }

    return S_OK;
}
What this command does:
✅ Locates the ObpObjectTypes global variable in kernel memory.
✅ Iterates through all object types and extracts useful data.
✅ Displays results in the debugger window.
Step 4: Exporting the Commands
To make our command available in WinDbg, we must export it in a module definition file (.def):
LIBRARY TypesExt
EXPORTS
    DebugExtensionInitialize
    objecttypes
This ensures that WinDbg recognizes our custom commands when the DLL is loaded.
Step 5: Building and Loading the Extension
1️⃣ Compile the DLL in Visual Studio.
2️⃣ Load the extension in WinDbg using:
.load path\to\TypesExt.dll3️⃣ Run the command:
!objecttypes4️⃣ Verify the output—you should see a list of object types from kernel memory.
Enhancing the Extension: Adding a Clickable Debugger Markup Language (DML) Link
To make debugging even more interactive, let’s modify the output to make object addresses clickable in WinDbg.
HRESULT CALLBACK objecttypes(PDEBUG_CLIENT Client, PCSTR Args) {
    CComPtr<IDebugControl> Control;
    Client->QueryInterface(__uuidof(IDebugControl), (void**)&Control);

    ULONG64 objTypesAddr = GetExpression("nt!ObpObjectTypes");
    if (objTypesAddr == 0) {
        dprintf("Error: Could not locate nt!ObpObjectTypes.\n");
        return E_FAIL;
    }

    while (true) {
        ULONG64 typeAddr;
        if (ReadPointer(objTypesAddr, &typeAddr) != S_OK || typeAddr == 0) break;
        objTypesAddr += sizeof(ULONG64);

        CHAR typeName[MAX_PATH];
        if (GetFieldValue(typeAddr, "nt!_OBJECT_TYPE", "Name", typeName) == S_OK) {
            Control->Output(
                DEBUG_OUTCTL_AMBIENT_DML,
                "<link cmd=\"dt nt!_OBJECT_TYPE 0x%I64x\">%s</link>\n",
                typeAddr, typeName);
        }
    }

    return S_OK;
}
Now, clicking the output link in WinDbg will execute:
dt nt!_OBJECT_TYPE 0x<address>to automatically display details about the object type!
Why Writing WinDbg Extensions is Important for TrainSec Students
For students enrolled in Windows Internals, Kernel Debugging, or Security Research, writing WinDbg extensions is a game-changer. Here’s why:
✅ Automate Debugging Tasks – No more manual memory inspections!
✅ Extract Hidden Data – Kernel symbols expose undocumented structures.
✅ Analyze Crash Dumps More Efficiently – Debug faster and smarter.
✅ Develop Malware & Rootkit Detection Tools – Many malware analysis workflows rely on custom WinDbg extensions.
If you’re serious about mastering Windows debugging, learning how to extend WinDbg is a must-have skill.
Next Steps: Learn More at TrainSec
WinDbg is a powerful tool, but mastering it requires practice and hands-on experience. At TrainSec, we offer advanced courses on:
🔥 Mastering WinDbg – Deep-dive into debugging techniques.
🔍 Windows Internals Master – Learn how the Windows kernel operates.
🛡️ Windows Security Researcher – Reverse-engineering malware with WinDbg.
Want to become a WinDbg expert? Join TrainSec and take your skills to the next level.
Explore the accompanying video for a detailed walkthrough of the code and concepts, and keep experimenting.
For more insights into Windows internals and advanced programming concepts, keep exploring TrainSec’s free Knowledge Library. Stay tuned for more deep dives into topics that empower your technical growth!