Learn Microsoft’s WinDbg debugger with Pavel Yosifovich, co-author of Windows Internals. Debug user mode processes and the Windows kernel, with and without source code, set up symbols and advanced breakpoints, analyze crash dumps with !analyze, and write your own debugger extension in C++.



11+ hours
on-demand video
Live demos
in user mode and kernel mode
60
video lessons
5
downloadable resources
11 CPE
CEU credits, self-reported
Certification
Certificate of completion
Mastering WinDbg is an online WinDbg course by Pavel Yosifovich, co-author of Windows Internals, 7th Edition, Part 1. It teaches Microsoft’s debugger in user mode and kernel mode, with and without source code, from symbols and breakpoints to crash dump analysis and writing your own extension in C++.
The demos use the new WinDbg, and the course also shows how to install the classic Debugging Tools for Windows from the SDK or WDK, and where CDB, NTSD and KD fit. The targets are real: Notepad and Paint in user mode, a Hyper-V virtual machine for kernel debugging, and sample programs to hunt bugs in.
The course has 60 pre-recorded video lessons, 11 hours 7 minutes of video, with English and Spanish captions on every lesson. You also get the slides PDF, debug and release sample binaries, the full sample source code and the extension project. You learn at your own pace, with lifetime access.
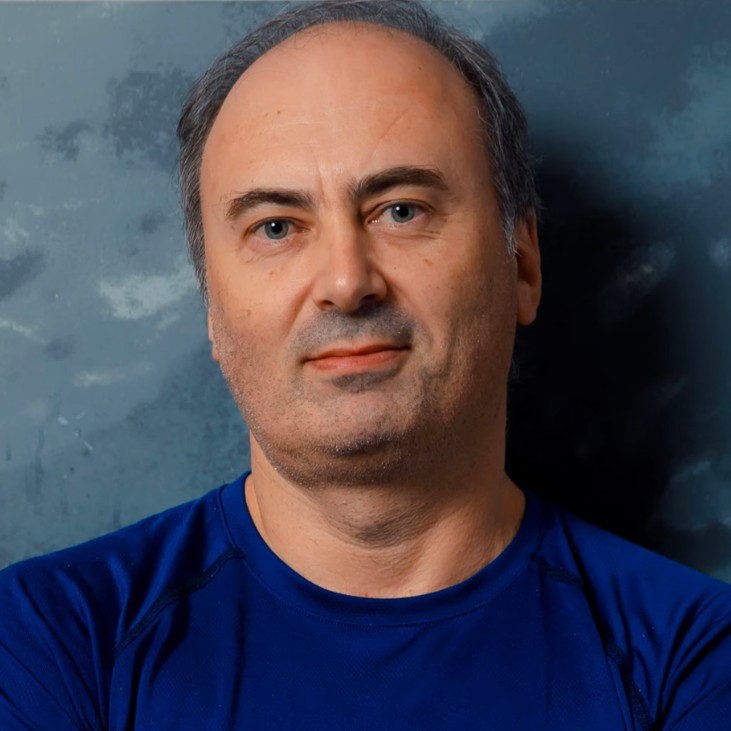
Pavel has been working at the lowest levels of Windows for more than 25 years, as a developer, consultant, trainer, author and speaker, and is a Microsoft MVP. He is the co-author of “Windows Internals, 7th Edition, Part 1” (Microsoft Press) and the author of “Windows Kernel Programming”, “Windows 10 System Programming” and “Windows Native API Programming”.
In this course he teaches the debugger he uses in the demos of his Windows Internals courses, from the first commands to writing your own extension.
Not the right fit if you are completely new to Windows internals (start with Windows Internals: Day 1), if you want the Windows internals concepts themselves in depth (the Windows Internals Day 1 to Day 5 courses teach those, while this course teaches the debugger), or if you are mainly after the Sysinternals tools (Sysinternals Tools Deep Dive 1 covers them tool by tool).
WinDbg handles user mode code, the Windows kernel and crash dumps in one tool, and it rewards knowing how it works: its three kinds of commands, correct symbols, and what the call stack and registers can tell you.
The course has eight chapters: introduction, WinDbg basics, user mode debugging, kernel mode debugging, advanced WinDbg, dump files, debugger extensions, and a short Windows architecture review. It is part of the Windows Internals Master and Windows Security Researcher learning paths.
A full chapter sets up local kernel debugging and remote debugging over the network with a virtual machine as the target. Our knowledge library also has a step-by-step setup on a Windows VM. You then inspect processes and threads with !process and !thread, walk the EPROCESS and ETHREAD structures, read the system service table, set process-specific breakpoints, and examine job objects, the object manager with handles and security descriptors, drivers, devices and IRPs.
Capture a user mode dump with WinDbg, Task Manager, Process Explorer or ProcDump, or configure Windows to write a kernel dump. Open it in WinDbg and run !analyze -v to read the bug check, its parameters and the likely cause. The Dump Files chapter does this step by step, including generating a kernel dump with NotMyFault. For a first look at the topic, read our practical deep dive on the blue screen of death.
A 35-minute demo debugs a prime-number calculator app with four calculation variants. You diagnose a file-write race between threads from call stacks and handle information, confirm a correct version that uses a critical section with !cs, find memory that was freed too early and locate the writer with a ba write breakpoint, and identify a heap corruption caused by an undersized allocation.
The advanced chapters cover command lists and trace points on breakpoints, ba and bm breakpoints, and LINQ-style queries over processes and threads with dx. You use the fltkd, Mex and SOS extensions, read a dump file from C++ with the COM-based dbgeng API, and build a working WinDbg extension that walks a linked list and runs commands per entry. The source is provided. For a preview, see a short walkthrough of writing an extension.
For security research, continue with Malware Analyst Professional – Level 1, the next course on the Windows Security Researcher path. For driver work, take Windows Kernel Programming 1. For deeper internals, take the remaining Windows Internals days. x64 Architecture and Programming (Part 1) makes disassembly in WinDbg easier to follow, and Sysinternals Tools Deep Dive 1 goes through the tools this course uses only to capture dumps or cross-check results.
A course overview, then installing the Debugging Tools for Windows and the new WinDbg. How WinDbg, CDB, NTSD and KD share one debugger engine, and when to use a 32-bit or a 64-bit debugger.
The fundamentals shared by user mode and kernel mode debugging: the debugger UI, the three command types, symbols and the Microsoft symbol server, plus a review of processes, threads, stacks, x86 and x64 registers, calling conventions, A and W string APIs, modules and source debugging.
Launching versus attaching, switching threads and processes, the TEB and PEB, displaying types with dt and dx, call stacks, breakpoints on APIs such as CreateFileW, reading arguments and return values through the x64 calling convention, handles, editing memory, modules and symbol searches, and source-level debugging.
Setting up local and remote (network) kernel debugging with a Hyper-V virtual machine as the target, then inspecting EPROCESS and ETHREAD, the process list, system service tables, process-specific breakpoints, job objects, the object manager with handles, reference counts, security descriptors and named objects, drivers and devices, and IRPs.
Debugger events and first and second chance exceptions, advanced breakpoints, MASM versus C++ expressions, memory and heap commands, child process debugging, and the dx debugger object model. It closes with a long demo diagnosing synchronization, use-after-free and heap corruption bugs.
Live versus dump debugging and the dump types. You capture user mode dumps with WinDbg, Task Manager, Process Explorer and ProcDump, debug a kernel driver live, configure and generate kernel dumps, including with NotMyFault, and analyze them with !analyze -v and the bug check documentation.
Where bang commands come from, with demos of fltkd, Mex and SOS for .NET. Then the COM-based debugger engine API (dbgeng) with a C++ example that reads a dump file, and a working WinDbg extension built from scratch.
A short appendix on the Windows concepts the course relies on: processes and their resources, virtual memory and address space layouts on 32-bit and 64-bit systems, and the user mode and kernel mode architecture, including the system call path.
WinDbg is Microsoft’s debugger for Windows. It can debug user mode and kernel mode code, with or without source code, and analyze crash dumps.
Yes. WinDbg is a free download from Microsoft, so the only thing you pay for here is the course.
The demos use the new WinDbg. The course also shows how to install the classic Debugging Tools for Windows from the SDK or WDK, and explains the console debuggers CDB, NTSD and KD.
No full assembly course is required. The course reviews x64 registers and calling conventions so you can find arguments and return values, but being able to read basic disassembly helps. x64 Architecture and Programming (Part 1) covers that in depth.
A Windows 10 or 11 machine where you have administrator rights, WinDbg and access to the Microsoft symbol server. The kernel debugging and crash demos use a virtual machine as the target (the course shows Hyper-V; VMware or VirtualBox also work), and Visual Studio is needed for the C++ extension and debugger API lessons.
Yes. A full chapter covers local kernel debugging and remote network kernel debugging with a VM, then processes and threads, system calls, jobs, objects and handles, drivers, devices and IRPs in the kernel debugger.
Yes. The Dump Files chapter covers capturing user mode dumps with WinDbg, Task Manager, Process Explorer and ProcDump, configuring and generating kernel dumps, and analyzing crashes and bug checks with !analyze.
There is one lesson on the SOS extension for .NET (managed threads, stacks, breakpoints and heap statistics). The course is mainly about native C/C++ code and the Windows kernel, so it is not a full .NET debugging course.
Yes. The Debugger Extensions chapter shows the COM-based debugger engine API with a C++ dump reader, then builds a working WinDbg extension DLL from scratch, with the source provided.
The Windows Internals courses use WinDbg to show how Windows works and teach only what their demos need. Mastering WinDbg teaches the debugger itself end to end, including dump analysis, the object model and extensions.
Pre-recorded and self-paced on the TrainSec learning platform.
60 video lessons with 11 hours 7 minutes of video, plus the slides PDF, two short text lessons and four ZIP downloads.
Yes. All 60 video lessons have English and Spanish captions.
Yes. Two lessons are free to preview: Overview and WinDbg Overview. You can watch them on the course page on the learning platform.
Yes. When you complete every lesson you receive a certificate of completion and a Credly badge. The course earns 11 CPE/CEU credits, which you self-report to your certification body with your TrainSec certificate.
$175 as a single payment, or 2 payments of $92 ($184 in total). It is also included in the Windows Internals Master and Windows Security Researcher learning paths.
Lifetime access, including future updates to the course.
Refunds are available up to 14 days after purchase, to the original payment method. Email [email protected] to request one.
Pavel has been working at the lowest levels of Windows for more than 25 years, as a developer, consultant, trainer, author and speaker, and is a Microsoft MVP. He is the co-author of “Windows Internals, 7th Edition, Part 1” (Microsoft Press) and the author of “Windows Kernel Programming”, “Windows 10 System Programming” and “Windows Native API Programming”.
In this course he teaches the debugger he uses in the demos of his Windows Internals courses, from the first commands to writing your own extension.
Learn Microsoft’s WinDbg debugger with Pavel Yosifovich, co-author of Windows Internals. Debug user mode processes and the Windows kernel, with and without source code, set up symbols and advanced breakpoints, analyze crash dumps with !analyze, and write your own debugger extension in C++.
